Huge packet losses with OVN
A service provided by the Nectar Cloud is ‘Tenant Networks’, where a user can create their own networks in their tenancy to connect VMs together. Tenant Networks have the following features:
- They are private to the tenant, in the sense that there can be multiple e.g. 192.168.1.0/24 networks created by different users and they are all isolated from each other
- Network can span across availability zones, which means VMs in Queensland and Melbourne can be connected to the same network.
- Traffic from these network are NAT’ed for egress to the internet
- Similarly, ingress traffic can be NAT’ed via Floating IPs.
The type of software that drives this are called Software Defined Network (SDN). The SDN Nectar is using is MidoNet. Due to MidoNet being unmaintained and the OpenStack community moving to OVN, we are currently migrating our SDN from MidoNet to OVN.
Infrastructure
Nectar has Availability Zones (AZs) all over Australia. Compute Nodes in each AZs are on private RFC1918 networks. For a SDN to work properly, Compute Nodes in each AZs need to be able to any other Compute Nodes. To do that, we created an additional overlay network named ‘WAGNET’.
To create WAGNET, Network Nodes in each AZs forms a mesh-like network with other AZs using tunnels over the public Internet. A simplified diagram of two AZs with Compute and Network nodes look like this
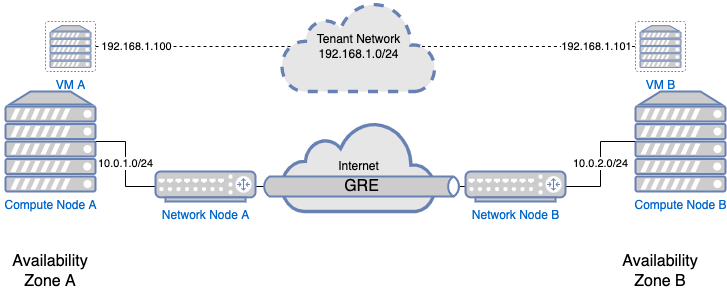
In this diagram, a tenant has VMs in two AZs. They have created a Tenant Network (192.168.1.0/24) which is purely virtual. Traffic destined for VM in another AZ are encapsulated by the Compute Node, then further encapsulated by Network Node and passed over the Internet.
OVN Testing
As part of our testing, we migrate test networks before and after migration using iperf3 to see if there is any performance difference. Unfortunately, this testing revealed a huge traffic drop in some places when the network was changed from MidoNet to OVN.
An example output of the iperf3 test looks like
root@jakeo1:~# iperf3 -c 192.168.2.150
Connecting to host 192.168.2.150, port 5201
[  5] local 192.168.2.211 port 50058 connected to 192.168.2.150 port 5201
[ ID] Interval           Transfer     Bitrate         Retr  Cwnd
[  5]   0.00-1.00   sec   102 KBytes   833 Kbits/sec    9   2.83 KBytes
[  5]   1.00-2.00   sec  0.00 Bytes    0.00 bits/sec   15   5.66 KBytes
[  5]   2.00-3.00   sec  31.1 KBytes   255 Kbits/sec   12   2.83 KBytes
[  5]   3.00-4.00   sec  31.1 KBytes   255 Kbits/sec   10   2.83 KBytes
[  5]   4.00-5.00   sec  31.1 KBytes   255 Kbits/sec    6   2.83 KBytes
[  5]   5.00-6.00   sec  31.1 KBytes   255 Kbits/sec    9   1.41 KBytes
[  5]   6.00-7.00   sec  31.1 KBytes   255 Kbits/sec    9   5.66 KBytes
[  5]   7.00-8.00   sec  0.00 Bytes    0.00 bits/sec    9   1.41 KBytes
[  5]   8.00-9.00   sec  31.1 KBytes   255 Kbits/sec   11   5.66 KBytes
[  5]   9.00-10.00  sec  0.00 Bytes    0.00 bits/sec   10   2.83 KBytes
- - - - - - - - - - - - - - - - - - - - - - - - -
[ ID] Interval           Transfer     Bitrate         Retr
[  5]   0.00-10.00  sec   288 KBytes   236 Kbits/sec  100             sender
[  5]   0.00-10.04  sec   238 KBytes   194 Kbits/sec                  receiver

iperf Done.
Comparatively, a good iperf3 looks like this (reverse direction using the -R flag)
root@jakeo1:~# iperf3 -c 192.168.2.150 -R
Connecting to host 192.168.2.150, port 5201
Reverse mode, remote host 192.168.2.150 is sending
[  5] local 192.168.2.211 port 50062 connected to 192.168.2.150 port 5201
[ ID] Interval           Transfer     Bitrate
[  5]   0.00-1.00   sec  51.6 MBytes   433 Mbits/sec
[  5]   1.00-2.00   sec  69.7 MBytes   585 Mbits/sec
[  5]   2.00-3.00   sec  69.6 MBytes   584 Mbits/sec
[  5]   3.00-4.00   sec  69.7 MBytes   585 Mbits/sec
[  5]   4.00-5.00   sec  70.5 MBytes   591 Mbits/sec
[  5]   5.00-6.00   sec  70.3 MBytes   589 Mbits/sec
[  5]   6.00-7.00   sec  70.5 MBytes   591 Mbits/sec
[  5]   7.00-8.00   sec  70.3 MBytes   589 Mbits/sec
[  5]   8.00-9.00   sec  70.4 MBytes   591 Mbits/sec
[  5]   9.00-10.00  sec  70.1 MBytes   588 Mbits/sec
- - - - - - - - - - - - - - - - - - - - - - - - -
[ ID] Interval           Transfer     Bitrate         Retr
[  5]   0.00-10.03  sec   686 MBytes   573 Mbits/sec    0             sender
[  5]   0.00-10.00  sec   683 MBytes   573 Mbits/sec                  receiver

iperf Done.
It is obvious that the bitrate is horrible, and the small congestion window (Cwnd) size leads us to believe that packets are being dropped, leading to congestion detection decreasing Cwnd.
On the surface, this was a very interesting problem because It affected VMs at different availability zones (AZs), and in different directions. Nectar has AZs all over Australia. We started doing iperf3 tests between sites in different locations.
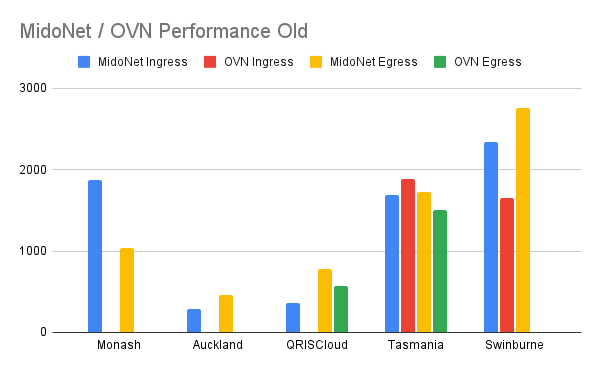
For Monash and Auckland. OVN’s throughput is basically nothing (few kbps). For OVN ingress to QRISCloud, it is also basically nothing. Strangely for Swinburne it is the opposite - egress traffic was the one that dropped substantially.
Debugging
Since there isn’t an easily discernible pattern at first sight, we suspected that this might be a combination of problems. After ruling out hardware and software and site config, we started tcpdumping iperf3 tests.
After a long few days we found out the problem. Below is a tcpdump of two hosts. On the left is a hypervisor, and on the right is a network node. They are capturing the same flow of an iperf3 test.
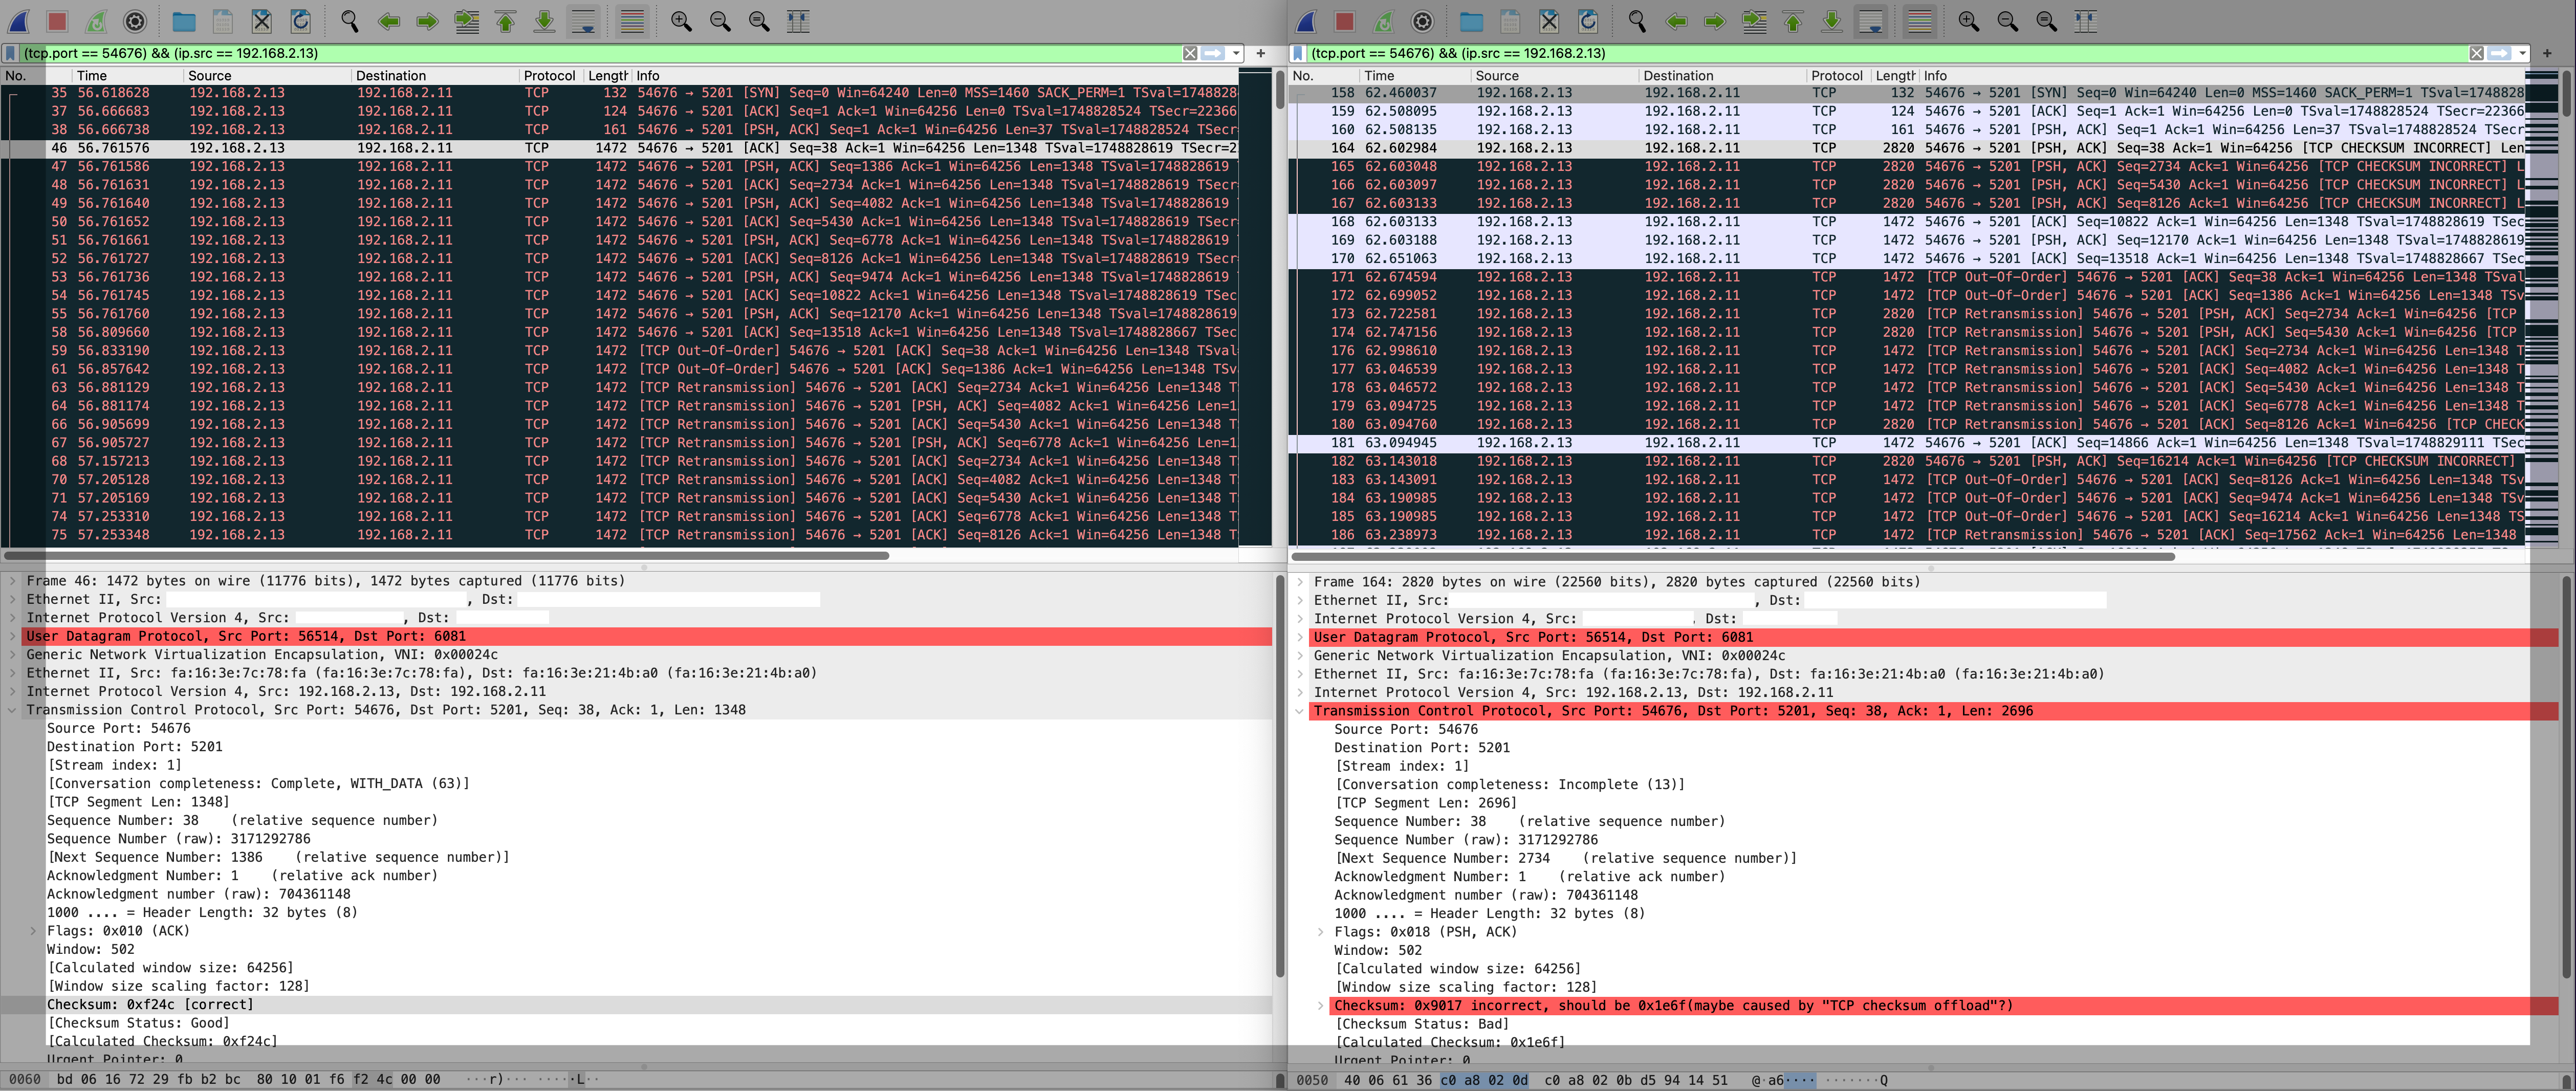
Here we can see that two packets are combined into one. Below are tcpdumps from two places in the network.
We can see that the first 3 packets (#35, #37, #38) on the left is the same as the first 3 packets (#158, #159, #160) on the right. All is good.
Next up is where the problem starts. Packet 46 on the left is 1472 byte packet. On the right, this appears to be a 2820 byte packet.
Looking deeper, there are a few things with this
- It seems that 2 of the packets on the left (#46, #47) are combined into 1 (#164)
- This can be derived from screenshot because
- Left packet - outer length = 1472 bytes (shown)
- Left packet - inner length of TCP data = 1348 bytes (shown)
- Therefore, there must be 1472 - 1348 = 124 bytes of header
- Right packet - outer length = 2820 bytes (shown)
- Right packet - inner length = 2696 bytes (not displayed, can be derived from subtracting header)
- 2 * 1348 bytes (left packet data) = 2696 bytes (right packet data)
- the checksum of the innermost TCP packets on the right (#164, #165, #166, #167) appears to be invalid
- So 8 packets where smooshed together
- #46 + #47 = #164
- #48 + #49 = #165
- #50 + #51 = #166
- #52 + #53 = #167
- Finally #54 = #168. This looks like a valid packet.
TCP dump further down the line indicates the smooshed packets #164-#167 never made it to the final destination. This resulted in lost packets in iperf3, causing iperf3 to drop the window size.
One of the thing that does this is Generic Receive Offload. (more information at the end). We started trying to toggle off offloads in our environment, and that confirms GRO being the culprit!
Before
ubuntu@jakeo3:~$ iperf3 -c 192.168.2.11
Connecting to host 192.168.2.11, port 5201
[  5] local 192.168.2.13 port 54716 connected to 192.168.2.11 port 5201
[ ID] Interval           Transfer     Bitrate         Retr  Cwnd
[  5]   0.00-1.00   sec  71.1 KBytes   582 Kbits/sec   13   2.63 KBytes
[  5]   1.00-2.00   sec  0.00 Bytes  0.00 bits/sec    9   2.63 KBytes
[  5]   2.00-3.00   sec  0.00 Bytes  0.00 bits/sec    8   3.95 KBytes
[  5]   3.00-4.00   sec  0.00 Bytes  0.00 bits/sec    8   2.63 KBytes
[  5]   4.00-5.00   sec  43.4 KBytes   356 Kbits/sec    7   1.32 KBytes
[  5]   5.00-6.00   sec  0.00 Bytes  0.00 bits/sec    9   2.63 KBytes
[  5]   6.00-7.00   sec  42.1 KBytes   345 Kbits/sec    7   2.63 KBytes
[  5]   7.00-8.00   sec  0.00 Bytes  0.00 bits/sec    9   2.63 KBytes
[  5]   8.00-9.00   sec  0.00 Bytes  0.00 bits/sec    8   2.63 KBytes
[  5]   9.00-10.00  sec  42.1 KBytes   345 Kbits/sec    7   2.63 KBytes
- - - - - - - - - - - - - - - - - - - - - - - - -
[ ID] Interval           Transfer     Bitrate         Retr
[  5]   0.00-10.00  sec   199 KBytes   163 Kbits/sec   85             sender
[  5]   0.00-10.05  sec   150 KBytes   122 Kbits/sec                  receiver
After
ubuntu@jakeo3:~$ iperf3 -c 192.168.2.11
Connecting to host 192.168.2.11, port 5201
[  5] local 192.168.2.13 port 54720 connected to 192.168.2.11 port 5201
[ ID] Interval           Transfer     Bitrate         Retr  Cwnd
[  5]   0.00-1.00   sec  38.5 MBytes   323 Mbits/sec    0   5.61 MBytes
[  5]   1.00-2.00   sec  58.8 MBytes   493 Mbits/sec    5   3.93 MBytes
[  5]   2.00-3.00   sec  60.0 MBytes   503 Mbits/sec    0   3.93 MBytes
[  5]   3.00-4.00   sec  61.2 MBytes   514 Mbits/sec    0   3.93 MBytes
[  5]   4.00-5.00   sec  55.0 MBytes   461 Mbits/sec   73   2.88 MBytes
[  5]   5.00-6.00   sec  51.2 MBytes   430 Mbits/sec   32   1.48 MBytes
[  5]   6.00-7.00   sec  26.2 MBytes   220 Mbits/sec   17   1.11 MBytes
[  5]   7.00-8.00   sec  23.8 MBytes   199 Mbits/sec    0   1.18 MBytes
[  5]   8.00-9.00   sec  18.8 MBytes   157 Mbits/sec    1    908 KBytes
[  5]   9.00-10.00  sec  16.2 MBytes   136 Mbits/sec    7    685 KBytes
- - - - - - - - - - - - - - - - - - - - - - - - -
[ ID] Interval           Transfer     Bitrate         Retr
[  5]   0.00-10.00  sec   410 MBytes   344 Mbits/sec  135             sender
[  5]   0.00-10.05  sec   407 MBytes   340 Mbits/sec                  receiver
Recap
Remember at beginning we said it seems to be a combination of problems? It turns out that GRO at different areas were messing different flows up. We had to do multiple iperf3 tests and tcpdumps to figure out which links were not optimal, and fix them accordingly. This writeup so far is simplified for a single case, but it is more complicated, if you don’t feel bored read the following:
- On a VM, TCP Segment Offload (TSO) or Generic Segment Offload (GSO) is used. An application needing to send a big chunk of data over the network needs to break this into small pieces (segmentation). In software this segmentation is done using CPU, but can be CPU intensive. With TSO/GSO, an application dumps the big chunk to the NIC to perform segmentation. Wikipedia explains it better than me.
- GRO is the opposite of GSO. GRO takes segmented packets and combines then back together.
- A good way to debug this in a new system will be to turn off all offloads, start graphing iperf results, and then turn them on one by one.
All fixed!
When we have identified all problematic links, our graph looks like this
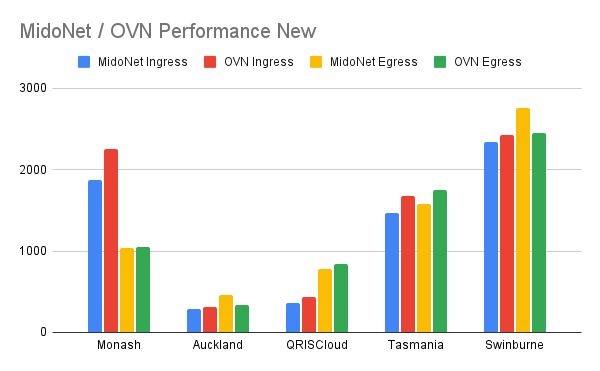
We believe that we have identified all the links that are not optimal. This gave us the confident to continue our migration to OVN.